- Published on
Quick ELK with Docker
Have you ever needed a quick and dirty way of setting up an elastic pipeline for local development? Me neither!
Here's how to do it.
The compose file
The compose file defines three services, one for ElasticSearch (having only one node for these purposes is enough, but scaling adding more is not a hard task at all), one for Kibana node and one for Filebeat. There's not much going on in the services, the only special part is that we're mounting a volume where filebeat is going to get all log files from and send them directly to ElasticSearch (we can add logstash in the middle here).
docker-compose.ymlAs you can probably see, we're configuring filebeat using a mounted filebeat-docker.yml file. Here it is.
So, what did we accomplish? Not a lot, but now anything logged to the configured logging directory (./log which is mounted to /var/log in the container) will be available in elastic search and visible through kibana. Take for example the following Spring Boot application and its logging configuration:
fun hey()
package com.bcorp.demo.elkg

// imports omitted for brevity

@SpringBootApplication
class ElkgSimpleApplication

fun main(args: Array<String>){
	runApplication<ElkgSimpleApplication>(*args)
}

@RestController
class HelloController{
	val log : Logger = LoggerFactory.getLogger(javaClass)
	val greetType = "Hello"
	@GetMapping("/greet")
	fun sayHello() : String {
		log.debug("Sending a greet : '{}'", greetType)
		return greetType
	}
}
<?xml version="1.0" encoding="UTF-8"?>
<configuration>
    <include resource="org/springframework/boot/logging/logback/defaults.xml" />
    <property name="LOG_FILE" value="${LOG_FILE:-${LOG_PATH:-${LOG_TEMP:-${java.io.tmpdir:-/tmp}}/}spring.log}"/>
    <include resource="org/springframework/boot/logging/logback/console-appender.xml" />

    <appender name="stash" class="ch.qos.logback.core.rolling.RollingFileAppender">
        <file>log/main.log</file>
        <rollingPolicy class="ch.qos.logback.core.rolling.TimeBasedRollingPolicy">
            <fileNamePattern>log/main.log.%d{yyyy-MM-dd_HH-mm}</fileNamePattern>
            <maxHistory>10</maxHistory>
        </rollingPolicy>
        <encoder class="net.logstash.logback.encoder.LoggingEventCompositeJsonEncoder">
            <providers>
                <pattern>
                    <omitEmptyFields>true</omitEmptyFields>
                    <pattern>
                        {
                            "timestamp": "%date{UTC}",
                            "severity" : "%level",
                            "threadName" : "%thread",
                            "logger": "%logger",
                            "className": "%class",
                            "message" : "%message",
                            "exception" : "%ex{full}"
                        }
                    </pattern>
                </pattern>
            </providers>
        </encoder>
    </appender>

    <root level="INFO">
        <appender-ref ref="stash"/>
    </root>

    <root level="INFO">
        <appender-ref ref="CONSOLE"/>
    </root>

    <logger name="com.bcorp" level="DEBUG"/>
</configuration>
If send some GET requests to the greet endpoint, we should start seeing the logs being sent to elastic search.
ab -n 1000 -c 10 http://localhost:8080/greet

This is ApacheBench, Version 2.3 <$Revision: 1807734 $>
Copyright 1996 Adam Twiss, Zeus Technology Ltd, http://www.zeustech.net/
Licensed to The Apache Software Foundation, http://www.apache.org/

Benchmarking localhost (be patient)
Completed 100 requests
Completed 200 requests
Completed 300 requests
Completed 400 requests
Completed 500 requests
Completed 600 requests
Completed 700 requests
Completed 800 requests
Completed 900 requests
Completed 1000 requests
Finished 1000 requests


Server Software:
Server Hostname:        localhost
Server Port:            8080

Document Path:          /greet
Document Length:        5 bytes

Concurrency Level:      10
Time taken for tests:   0.568 seconds
Complete requests:      1000
Failed requests:        0
Total transferred:      137000 bytes
HTML transferred:       5000 bytes
Requests per second:    1760.37 [#/sec] (mean)
Time per request:       5.681 [ms] (mean)
Time per request:       0.568 [ms] (mean, across all concurrent requests)
Transfer rate:          235.52 [Kbytes/sec] received

Connection Times (ms)
              min  mean[+/-sd] median   max
Connect:        0    0   0.3      0       4
Processing:     1    5  10.1      4     102
Waiting:        1    5   8.5      3      84
Total:          1    6  10.1      4     102

Percentage of the requests served within a certain time (ms)
  50%      4
  66%      5
  75%      6
  80%      6
  90%      9
  95%     12
  98%     16
  99%    102
 100%    102 (longest request)
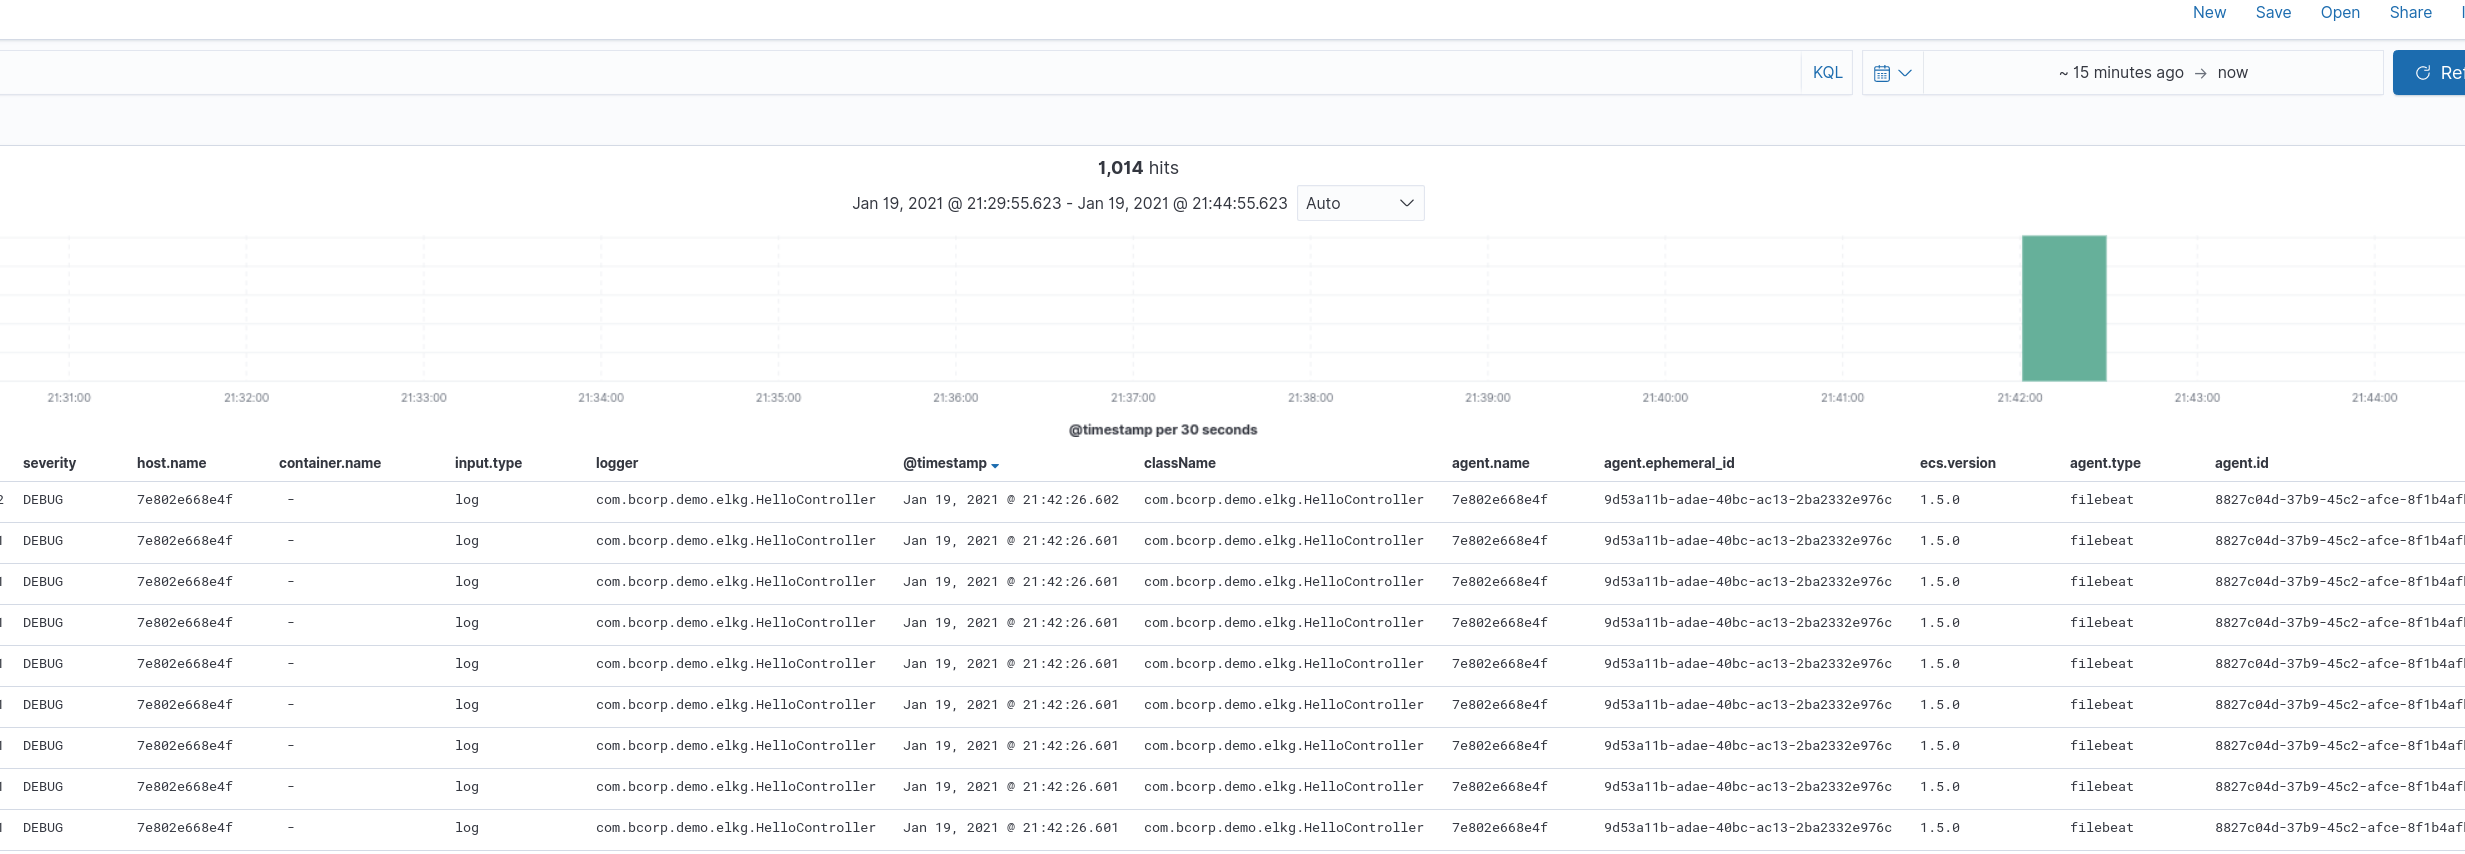
The kibana dashboard should have picked up everything. Provided you've created the filebeat index pattern, the logs should be visible.
http://localhost:5601
Conclusion
This is a very quick and dirty way to get the elastic stack running on a local environment, although it probably doesn't cover everything you'll need, its a good starting point. Check out the repo.